Data Analytics Course
- Description
- Curriculum
- FAQ
- Notice
- Reviews
- Grade

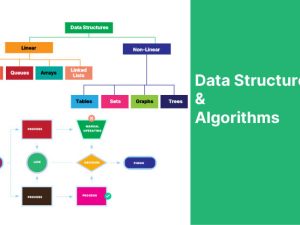
What is Data Analytics?
Data Analytics is the process of examining raw data to uncover patterns, draw conclusions, and help make informed business decisions. It involves various techniques such as data collection, cleaning, transformation, and visualization to understand trends, identify opportunities, and solve complex problems.
By using tools like Python, Tableau, Power BI, and MySQL, data analysts can transform large datasets into actionable insights, empowering organizations to make data-driven decisions. Data Analytics is widely used across industries such as finance, healthcare, marketing, and technology, making it a critical skill in today’s data-centric world.
The modules offered under this course are;
- Introduction to Data Analytics
- Data Analysis with Python
- Data Management with MySQL
- Data Visualization with Tableau
- Data Reporting with Power BI
- Capstone Project
What are the course requirements?
- A laptop/ computer (Preferably with 8GB RAM or more) with stable internet connection
- Possess basic computer skills
- Be eager to learn
- Be available for classes
Who is this course for?
- Aspiring Data Analysts: Those looking to break into the field of data analytics with practical, hands-on skills.
- Business Professionals: Individuals in roles such as finance, marketing, and operations who want to leverage data for insights and decisions.
- Students and Graduates: People aiming to build a career in data science, analytics, or business intelligence.
- Tech Enthusiasts: Developers or IT professionals seeking to expand their expertise into data-driven technologies.
Why you should learn Data Analytics?
High Demand Across Industries
Data is the backbone of modern businesses. Whether it’s finance, healthcare, retail, or tech, every industry relies on data to make informed decisions. Learning data analytics gives you the tools to be at the forefront of these data-driven insights.
Competitive Salaries
Data analysts are in high demand, and companies are willing to pay competitive salaries for skilled professionals. With the right skills in Python, MySQL, Tableau, and Power BI, you can open doors to lucrative career opportunities.
Diverse Career Paths
Data analytics is a versatile field. You can pursue careers in business intelligence, financial analysis, marketing, operations, or even specialize in emerging areas like AI and machine learning. The skills you learn are transferable across industries.
Improve Decision-Making
Data analytics equips you with the ability to make data-backed decisions. This is an invaluable skill whether you’re an entrepreneur, a business professional, or part of a decision-making team in any organization.
Future-Proof Your Career
With the rapid growth of big data, AI, and automation, data analytics has become a key skill for the future. Learning data analytics ensures you stay relevant and competitive in a constantly evolving job market.
Hands-on, Practical Skill Set
Data analytics is not just about theory; it’s a hands-on discipline. You’ll gain practical skills that can be applied immediately, allowing you to analyze data, create visualizations, and derive meaningful insights from real-world datasets.
What are the career opportunities?
Data analytics opens the door to a wide range of exciting and high-demand career paths. With skills in Python, MySQL, Tableau, and Power BI, you can pursue various roles across industries. Here are some of the top career opportunities:
Data Analyst – Analyze and interpret data to help businesses make informed decisions.
Responsibilities include data collection, cleaning, analysis, and visualization using tools like Python and Tableau.
Business Intelligence (BI) Analyst – Focus on using data to help businesses improve processes, increase profits, and become more efficient.
Work with tools like Power BI and MySQL to create dashboards and reports.
Data Scientist – Combine statistical analysis and programming to derive insights from large datasets.
Often work with machine learning algorithms and advanced analytics, beyond traditional analysis.
Financial Analyst – Use data analytics to evaluate financial data and trends to make investment decisions, manage budgets, and forecast economic conditions.
This role often requires strong skills in Python and data visualization.
Marketing Analyst – Use data to analyze market trends, customer behavior, and the effectiveness of marketing strategies.
Create actionable insights to improve marketing campaigns and boost ROI.
Operations Analyst – Focus on improving operational efficiency using data.
Analyze workflows, supply chains, and business processes to identify bottlenecks and areas for improvement.
Data Engineer – Design, construct, and maintain databases and data systems.
Ensure data pipelines are efficient, scalable, and can handle the business’s growing data needs.
Consultant (Data Analytics/Business Intelligence) – Provide expert advice to businesses on how to best use data for strategic advantage.
You’ll often work across industries, solving data-related problems and helping companies implement the best practices.
-
1
 Data Analytics Course Outline
Duration: 4 Weeks
Mode: Hands-on Practical Training
Tools: Power BI, SQL, Advanced Excel -
2
 Video Lesson
 -
3
Introduction to Data Analytics
-
4
Types of Data: Structured vs. Unstructured Data
-
5
Overview of Tools: SQL, Excel and Power BI
-
6
Differences & Use Cases of SQL, Excel & Power BI
-
7
Introduction to SQL & Databases
-
8
SQL Memes
-
9
Introduction to PostgreSQL, MySQL, and SQL Server.
-
10
Windows: Getting started with MySQL
-
11
Debian OS(Linux, Ubuntu, CentOS): Getting started with MySQL
-
12
MacOS: Getting started with MySQL
-
13
Video: Installing MySQL and Creating Databases
-
14
Running MySQL on Windows, Debian, Mac OS (VS Code)
-
15
SQL CREATE DATABASE
-
16
SQL Commands | DDL, DQL, DML, DCL and TCL Commands
-
17
Data Definition Language (DDL) in SQL
-
18
Data Query Language (DQL) in SQL
-
19
Data Manipulation Language (DML) in SQL
-
20
Data Control Language (DCL) in SQL
-
21
Transaction Control Language (TCL) in SQL
-
22
Summary: SQL Commands
-
23
 Quiz
Quiz -
24
Select Statement in MySQL
-
25
Where Clause in MySQL
-
26
Group By + Order By
-
27
Quiz: WHERE, GROUP BY, ORDER BY
-
28
 Sales Data Analysis
 -
29
Having vs Where in MySQL
-
30
Limit + Aliasing in MySQL
-
31
Joins in MySQL
-
32
Unions in MySQL
-
33
String Functions in MySQL
-
34
Case Statements in MySQL
-
35
MySQL Assignment: Intermediate SQL Practice
-
36
Subqueries in MySQL
-
37
Window Functions in MySQL
-
38
CTEs in MySQL((Common Table Expressions)
-
39
Temp Tables in MySQL
-
40
Stored Procedures in MySQL
-
41
Triggers and Events in MySQL
-
42
Advanced SQL Assignment
-
64
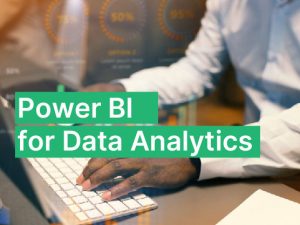
Introduction to Power BI
Power BI is a business intelligence and data visualization tool developed by Microsoft that helps users connect to data sources, transform raw data, and create interactive reports and dashboards. It enables organizations to make data-driven decisions by providing insights through powerful visual analytics.
What You Will Achieve by the End of This Introduction
By the end of this introduction to Power BI, you will:
✅ Understand the key components of Power BI (Desktop, Service, and Mobile Apps).
✅ Learn how to connect to various data sources like Excel, SQL Server, and cloud services.
✅ Explore data transformation using Power Query.
✅ Gain hands-on experience with data modeling and relationships.
✅ Create interactive visualizations such as charts, graphs, and dashboards.
✅ Learn how to publish and share reports securely.
✅ Understand the basic security and licensing options for Power BI. -
65
Overview of introduction to Power BI
Productivity Hacks to Get More Done in 2018
— 28 February 2017
- Facebook News Feed Eradicator (free chrome extension) Stay focused by removing your Facebook newsfeed and replacing it with an inspirational quote. Disable the tool anytime you want to see what friends are up to!
- Hide My Inbox (free chrome extension for Gmail) Stay focused by hiding your inbox. Click "show your inbox" at a scheduled time and batch processs everything one go.
- Habitica (free mobile + web app) Gamify your to do list. Treat your life like a game and earn gold goins for getting stuff done!