Power BI for Data Analytics
- Description
- Curriculum
- FAQ
- Notice
- Reviews
- Grade

Master Power BI and transform raw data into insightful, interactive dashboards.
This course covers
- data modeling,
- DAX formulas,
- visualization techniques, and
- report sharing.
Learn to
- connect multiple data sources,
- create compelling reports, and
- drive data-driven decisions with ease.
Perfect for beginners and professionals looking to enhance their analytics skills. 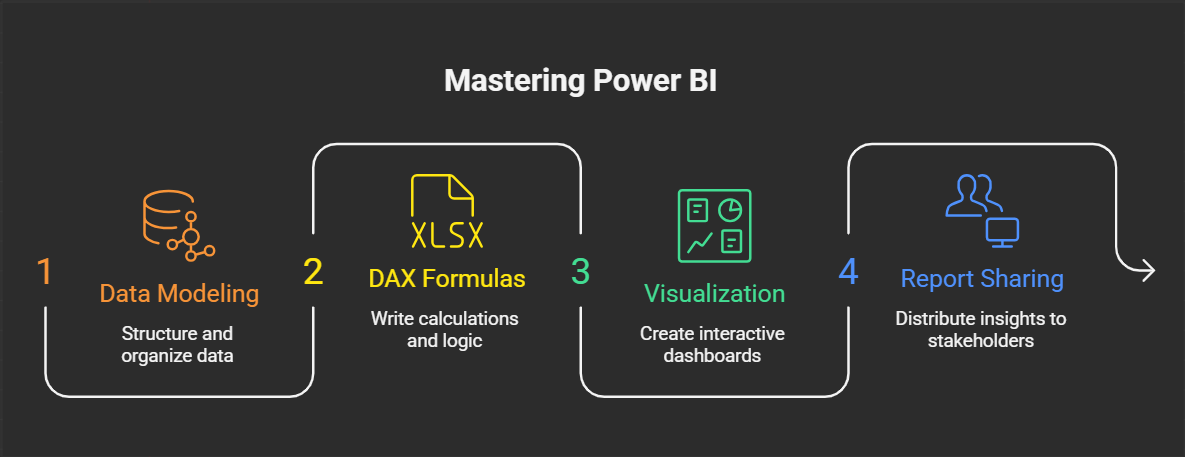
-
1
 Overview of introduction to Power BI
 -
2
 Introduction to Power BI
Power BI is a business intelligence and data visualization tool developed by Microsoft that helps users connect to data sources, transform raw data, and create interactive reports and dashboards. It enables organizations to make data-driven decisions by providing insights through powerful visual analytics.
What You Will Achieve by the End of This Introduction
By the end of this introduction to Power BI, you will:
✅ Understand the key components of Power BI (Desktop, Service, and Mobile Apps).
✅ Learn how to connect to various data sources like Excel, SQL Server, and cloud services.
✅ Explore data transformation using Power Query.
✅ Gain hands-on experience with data modeling and relationships.
✅ Create interactive visualizations such as charts, graphs, and dashboards.
✅ Learn how to publish and share reports securely.
✅ Understand the basic security and licensing options for Power BI.
Productivity Hacks to Get More Done in 2018
— 28 February 2017
- Facebook News Feed Eradicator (free chrome extension) Stay focused by removing your Facebook newsfeed and replacing it with an inspirational quote. Disable the tool anytime you want to see what friends are up to!
- Hide My Inbox (free chrome extension for Gmail) Stay focused by hiding your inbox. Click "show your inbox" at a scheduled time and batch processs everything one go.
- Habitica (free mobile + web app) Gamify your to do list. Treat your life like a game and earn gold goins for getting stuff done!


- Basic understanding of Excel (preferred but not mandatory).
- A computer with Windows OS (Power BI Desktop is not available on macOS).
- Power BI Desktop installed (free download from Microsoft).
- Internet connection for cloud-based features.
- Basic analytical and problem-solving skills.
- No prior coding or BI experience required!